Battery testers are often expected to answer a simple question: is the battery good or bad? In practice, battery condition is more difficult to determine. A conventional tester may report terminal voltage and an estimate of internal resistance, while the battery’s available capacity—the energy it can actually deliver—may remain unknown.
That distinction matters because a battery can appear charged and still be substantially degraded. Temperature, state of charge, recent charging or discharging, rest time, and measurement method all influence the result. More advanced diagnostic systems therefore combine several observations and compare them with battery-specific reference data instead of treating one reading as conclusive.
Why Battery Test Results Can Be Misleading
Most handheld battery testers measure voltage and apply a load, pulse, or other electrical stimulus to estimate resistance. These measurements are useful, but they do not necessarily measure capacity directly. Capacity testing normally requires controlled charging and discharging over a defined procedure, which is slower and more demanding than a quick field test.
It is also important to separate state of charge (SoC) from state of health (SoH). State of charge describes how much charge is presently available. State of health describes how the battery compares with its original or specified condition. A degraded battery may reach a normal-looking voltage after charging while storing much less energy than when new. Capacity fade is consequently one of the most important end-of-life indicators.
A battery can be treated as a black box: its external case does not reveal whether it is new, fully charged, deeply depleted, or internally damaged. Voltage-based SoC estimation is especially sensitive to test conditions. Surface charge can temporarily raise the voltage after charging, while discharge-related voltage depression can temporarily lower it. The battery may need a relaxation period before its terminal voltage better represents its electrochemical state. The appropriate rest time depends on chemistry, construction, temperature, and the preceding operating history; there is no single universal interval for every battery.
Pulse-based resistance testing applies a known current change and observes the resulting voltage change. A simplified relationship is:
resistance ≈ voltage change / current change
The measured value is not a single immutable property of the battery. It can include ohmic resistance, polarization effects, and other time-dependent behavior. Results vary with pulse duration, current level, temperature, state of charge, frequency content, connection resistance, and instrument design. For that reason, internal resistance alone is not a reliable substitute for a capacity measurement.
Voltage recovery after a load is removed can provide another diagnostic signal. The speed and shape of recovery may differ between batteries with different conditions, but the relationship is not universally definitive across chemistries and applications. Recovery should be interpreted with the test temperature, load profile, SoC, and battery history rather than used as a standalone pass-or-fail rule.
For lead-acid starter batteries, field failures can involve several different categories: loss of capacity, over-discharge, increased resistance, no fault detected during the test, and mechanical or manufacturing defects. A tester that identifies only a low-charge condition may prevent an unnecessary replacement, while a tester that detects degraded capacity may help distinguish a genuine battery fault from a customer-induced discharge. Exact failure distributions depend on the battery population and test protocol and should not be generalized without a verified dataset.
This problem also affects reliability-centered maintenance (RCM). RCM uses equipment functions, failure modes, condition indicators, and consequences of failure to determine appropriate maintenance actions. Batteries are difficult to integrate into this framework because their internal condition is not directly visible and because voltage, current, and temperature alone may not reveal remaining useful life. A battery-management system can estimate SoC and monitor operating limits, but estimating future capacity or failure time usually requires additional models, historical data, and validation.
Three aging characteristics are particularly important:
- Capacity fade: the battery stores and delivers less energy than it did when new.
- Increased resistance: voltage sag and heat generation increase under load, potentially reducing usable power.
- Elevated self-discharge: the battery loses stored charge more rapidly while inactive.
These effects can occur together or develop at different rates. Undetected degradation is also a safety concern. In lithium-ion systems, certain internal faults or abusive conditions can contribute to overheating and, in severe cases, thermal runaway. A diagnostic result cannot eliminate that risk, but better monitoring can help identify abnormal behavior earlier when the measurement system and decision limits have been properly validated.
For a critical battery system, three operational questions should be answered before selecting a test method:
- At what remaining capacity or performance level must the battery be replaced?
- Which electrical, thermal, or mechanical anomalies must the monitoring system detect?
- What are the operational and safety consequences if the battery fails without warning?
Modern Battery Test Technologies
Advanced battery diagnostics combine electrochemical measurements with reference data and computational analysis. Electrochemical impedance spectroscopy (EIS), statistical models, machine-learning methods, and connected monitoring can provide more information than a single voltage or resistance reading. Their accuracy, however, depends on battery chemistry, cell and pack design, operating history, calibration data, measurement conditions, and the quality of the model used for interpretation.
EIS applies small electrical signals over multiple frequencies and measures the resulting impedance response. The response contains both resistive and reactive components. It can be displayed as a Nyquist plot, with the real component of impedance on one axis and the negative imaginary component on the other. A plot may contain an intercept, curved regions such as semicircles, and low-frequency features associated with slower electrochemical processes.
Different frequency regions can reflect different processes, including ohmic resistance, interfacial layers, charge-transfer behavior, and diffusion. These associations are useful for analysis, but they are not universal one-to-one labels. The spectrum depends on chemistry, electrode construction, temperature, SoC, aging mechanism, and the electrical connections used during the test.
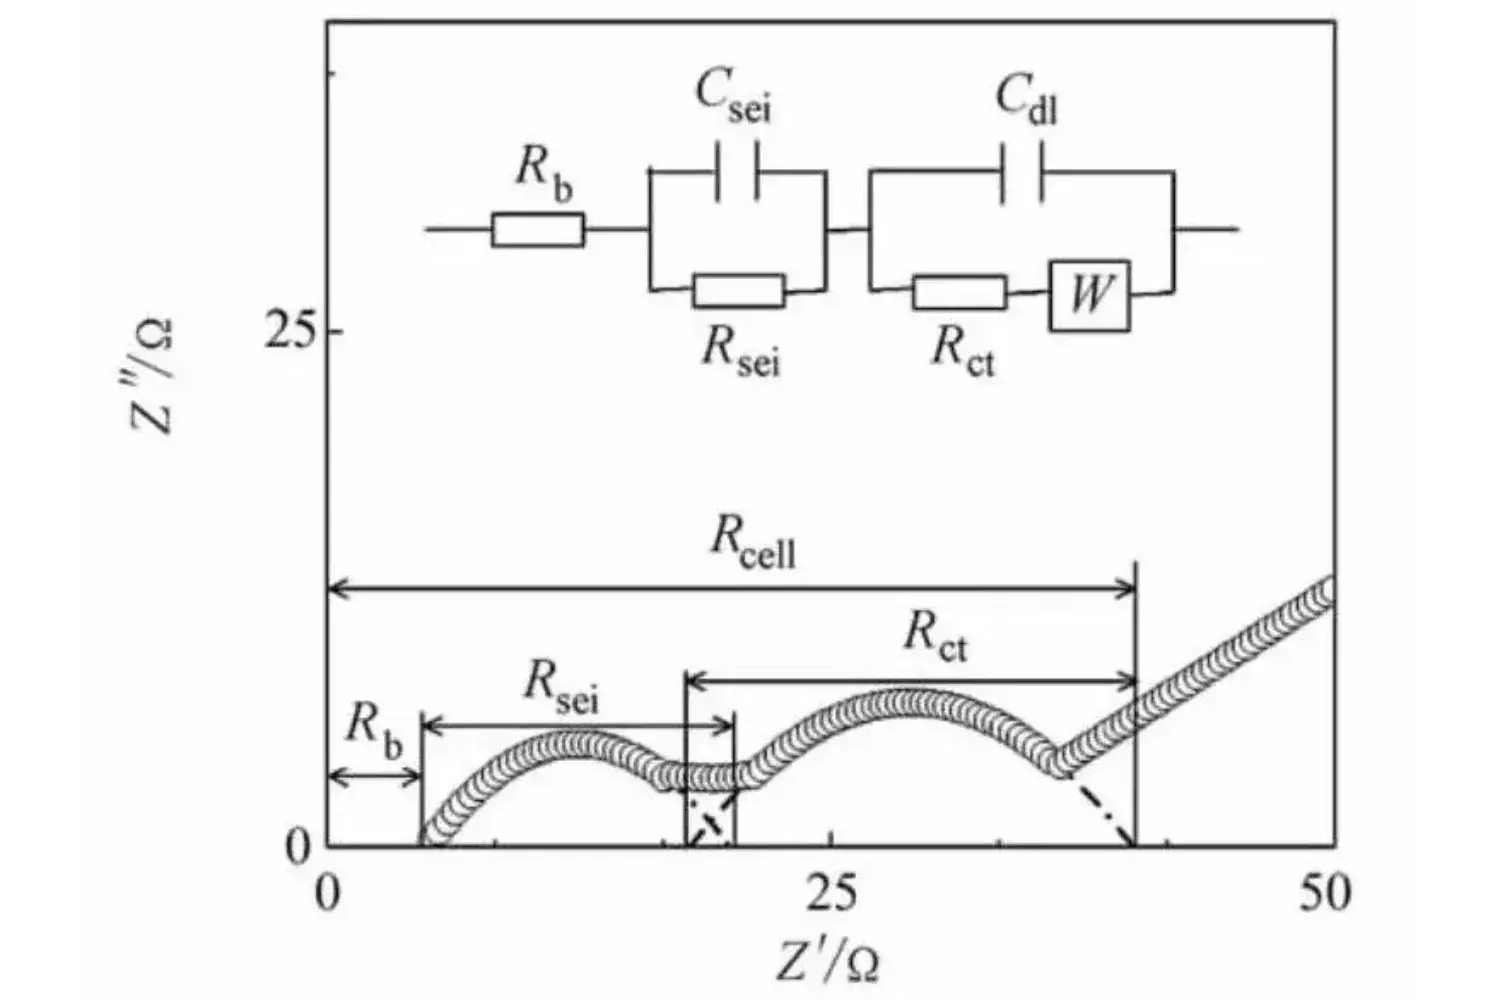
Source: Battery University
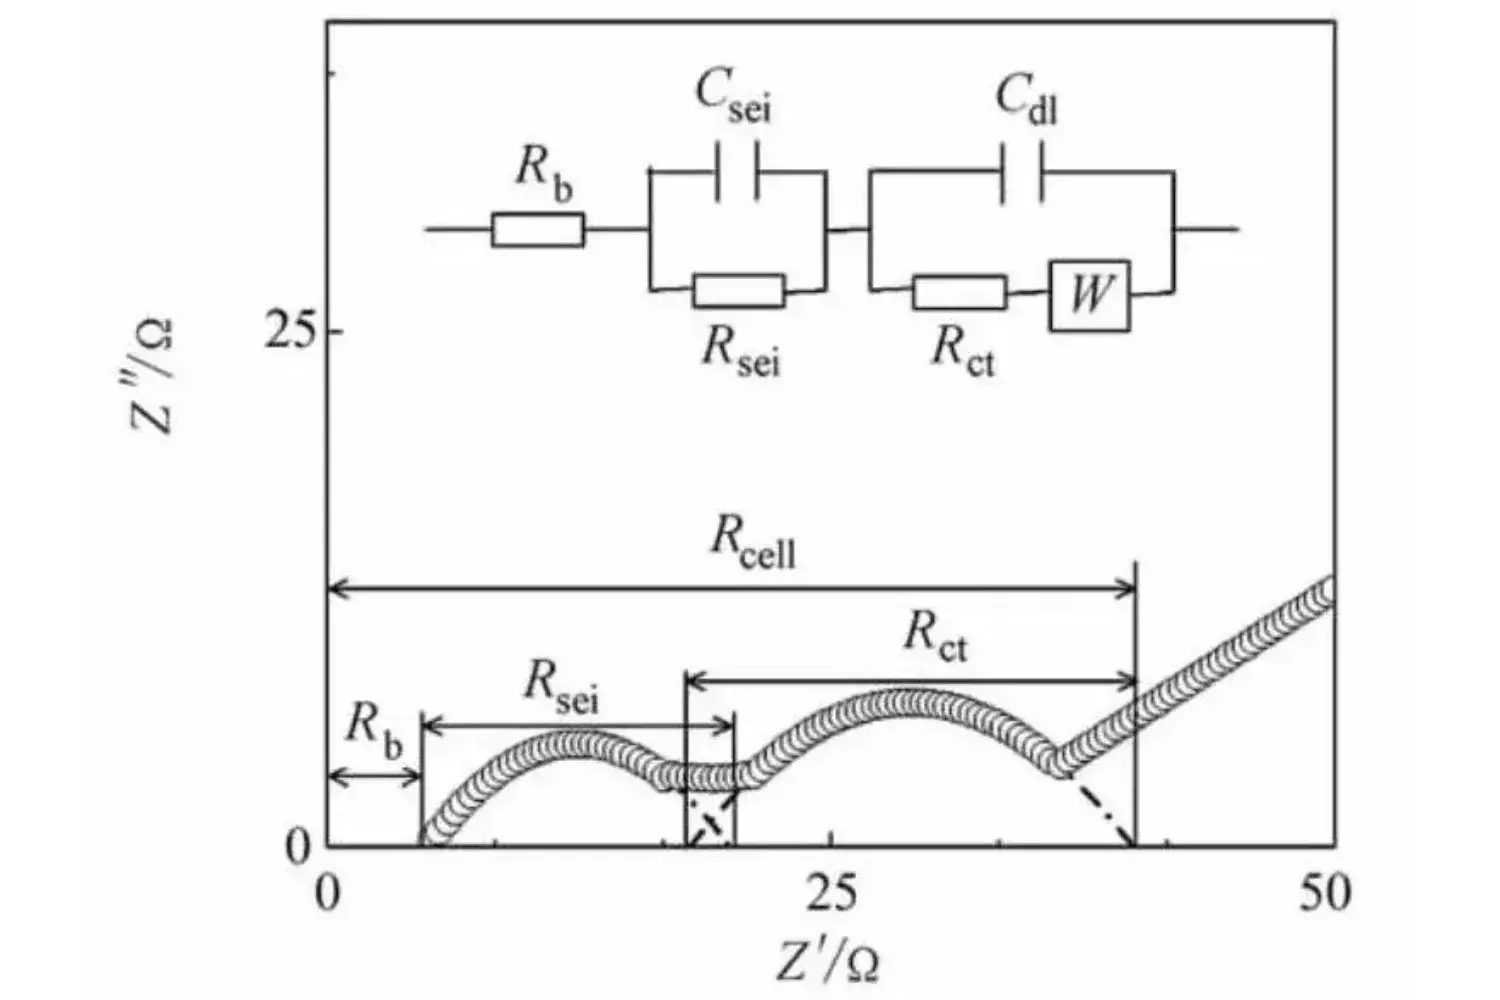
EIS can be non-destructive, but it is not automatically a quick or simple field measurement. Consistent comparisons require control of state of charge, temperature, rest time, recent cycling history, signal amplitude, frequency range, and connections. Low-frequency measurements may take significant time. Equivalent-circuit models also require care because different circuit arrangements can sometimes reproduce similar measured spectra.
How Electrochemical Impedance Spectroscopy Works
During an EIS test, the instrument applies a small alternating voltage or current perturbation and records the response. The ratio and phase relationship between the stimulus and response provide complex impedance as a function of frequency. A sequence of measurements creates an impedance spectrum rather than one resistance value.
The spectrum can then be compared with measurements from the same battery at different ages or operating conditions. Changes in the high-frequency region may indicate altered ohmic or connection-related behavior, while changes in curved or low-frequency regions may be associated with interfacial reactions, charge transfer, or transport limitations. Interpretation must remain chemistry-specific: a feature that is informative for one lithium-ion design may not have the same meaning in a lead-acid or nickel-metal-hydride battery.
Model fitting is commonly used to estimate parameters from the spectrum. A fitted model may represent resistive, capacitive, and diffusion-related elements. Such parameters can support estimates of SoH, internal resistance, or degradation trends, but they are inferred quantities. A good mathematical fit does not by itself prove that every fitted element corresponds uniquely to one physical failure mechanism.
Reference Models, Machine Learning, and Condition Estimates
A practical diagnostic system can compare a measured battery response with reference data from healthy and aged batteries. The reference set may include voltage, resistance, impedance spectra, capacity, temperature, SoC, cycle history, and other operating variables. Statistical methods can identify deviations, while machine-learning models can classify conditions or estimate quantities such as capacity and SoH.
Artificial neural networks, Gaussian-process regression, and other regression methods are possible approaches. Their performance is dataset-dependent. A reported accuracy from a controlled lead-acid study should not be treated as a universal result for all batteries, and comparisons between Gaussian-process and neural-network methods require attention to sample size, validation method, definition of accuracy, and test conditions. Without those details, a numerical accuracy claim is not transferable to a different battery fleet.
A battery-specific golden sample is a known-good reference battery or reference dataset for a particular design. Later measurements can be compared with it to identify changes. This approach can be useful when the battery model, manufacturing process, and measurement setup are controlled. One reference unit cannot necessarily represent all production variation, however. Age, tolerances, formulation changes, temperature, and operating history can all affect the baseline.
Claims about a proprietary tester or analytics platform should therefore be separated from general EIS capabilities. EIS can provide information-rich measurements, but the ability to estimate capacity or SoH depends on the instrument, model, training data, calibration procedure, and validation evidence.
From Starter-Battery Testers to Fleet Battery Analytics
Automotive starter-battery testing illustrates the difference between power and energy capability. Cold-cranking performance measures the ability to deliver high current under a specified test condition. A battery may still produce an acceptable cranking result while having lost reserve capacity or exhibiting reduced remaining useful life. A complete maintenance decision may therefore need more than a single cold-cranking estimate.
Advanced diagnostics may be used in handheld testers, battery-management systems, automotive service equipment, stationary storage, and fleet supervision. The objective is to combine field measurements with battery model information, BMS data, capacity thresholds, environmental conditions, and maintenance records.
Cloud connectivity can support this process by distributing reference data, collecting test results, tracking battery models and installation dates, and aggregating measurements from a fleet. It can also help identify recurring patterns that are difficult to see from one isolated test. Connected systems introduce their own requirements, including cybersecurity, access control, privacy, reliable communications, calibration management, and maintenance of the measurement hardware.
Replacement thresholds should be linked to the actual application. A threshold based on remaining capacity or power capability may prevent premature replacement while also limiting excessive service life. The correct threshold depends on the consequences of failure, required runtime, load profile, redundancy, and safety requirements. It should be validated rather than copied from a different chemistry or application.
Lead-acid and lithium-based batteries can both be assessed with advanced methods, but they should not be assumed to have interchangeable diagnostic models. Nickel-metal-hydride, lithium-ion, lead-acid, and other chemistries have different electrochemical behavior and aging mechanisms. Even batteries using the same nominal chemistry can require different models because of cell format, electrode design, control strategy, and operating history.
What Advanced Battery Diagnosis Can—and Cannot—Tell You
The central value of advanced testing is the interpretation of several symptoms together. This is similar to weather forecasting, facial recognition, or recognizing a spoken word: individual observations may be weak, but a combination of observations can produce a stronger pattern match.
Machine-learning systems work in this way. They infer relationships from data rather than directly observing one universal quantity called battery health. A model may identify a spectrum, voltage response, temperature pattern, or aging trajectory that resembles known examples. That inference can be useful, but it remains dependent on the data used to train and validate the system.
No single test result should automatically determine replacement. A low voltage may indicate discharge rather than permanent damage. A high resistance value may reflect temperature or test timing. A normal reading may miss capacity loss. Diagnosis is stronger when measurements are repeatable, operating conditions are recorded, and results are compared with an appropriate battery-specific baseline.
EIS, machine learning, neural networks, and cloud connectivity are potential components of future battery analytics, not guaranteed solutions. They can support fleet supervision, maintenance planning, reliability analysis, and safer operation when their limits are understood. They can also reduce unnecessary disposal when a battery is merely undercharged, while helping identify batteries that no longer meet the needs of a critical load.
The essential distinction is between measuring the electrochemical condition of a battery and processing peripheral digital measurements. A connected platform can organize data and deliver alerts, but connectivity does not make an invalid measurement valid. Likewise, an advanced model cannot compensate indefinitely for poor calibration, unsuitable reference data, uncontrolled temperature, or a chemistry it was not designed to represent.
Reliable battery diagnosis therefore depends on validated data, chemistry-specific models, manufacturing variation, operating history, controlled measurement conditions, calibration, and independent testing. Advanced tools can improve the evidence available to a maintenance decision, but the result should remain a reasoned condition assessment rather than an automatic conclusion from one number.
References
- Electrochemical Impedance Spectroscopy for Battery Testing: Practical Guide -. (n.d.). https://www.sinexcel-re.com/blog/electrochemical-impedance-spectroscopy-for-battery-testing-practical-guide
- A critical overview of definitions and determination techniques of the internal resistance using lithium-ion, lead-acid, nickel metal-hydride batteries and electrochemical double-layer capacitors as examples - ScienceDirect. (n.d.). https://www.sciencedirect.com/science/article/pii/S0378775315301245
- A critical overview of definitions and determination techniques of the internal resistance using lithium-ion, lead-acid, nickel metal-hydride batteries and electrochemical double-layer capacitors as examples - ScienceDirect. (n.d.). https://www.sciencedirect.com/science/article/abs/pii/S0378775315301245
- EIS Battery Analysis: Electrochemical Impedance Spectroscopy Guide. (n.d.). https://iestbattery.com/overview-of-electrochemical-impedance-spectroscopy
- EIS Testing For Battery Failure Analysis: A Complete Guide. (n.d.). https://iestbattery.com/case/diagnosing-lithium-battery-failure-with-eis
- Nyquist Plot for Impedance Measurement of Lithium-ion Batteries | HIOKI. (n.d.). http://www.hioki.com/us-en/learning/electricity/nyquist.html
- How Electrochemical Impedance Spectroscopy Supports Longer Battery Life and Safer Performance. (n.d.). https://blog.terma.com/how-eis-drives-longer-life-and-safer-performance
- IEST Advances Lithium-Ion Battery Health Diagnosis with. (n.d.). https://www.openpr.com/news/4593409/iest-advances-lithium-ion-battery-health-diagnosis-with
- (PDF) Battery State Estimation for Lead-Acid Batteries under Float Charge Conditions by Impedance: Benchmark of Common Detection Methods - Academia.edu. (n.d.). https://www.academia.edu/124941949/Battery_State_Estimation_for_Lead_Acid_Batteries_under_Float_Charge_Conditions_by_Impedance_Benchmark_of_Common_Detection_Methods
- Electrochemical Impedance Spectroscopy (EIS). (n.d.). https://www.gantner-instruments.com/products/special-products/electrochemical-impedance-spectroscopy