Battery condition cannot be reduced to a single voltage reading or a short pass/fail test. A battery may still operate while losing capacity, developing higher internal resistance, or becoming more sensitive to temperature and load. The useful question is therefore not only whether a battery works, but how much performance remains under defined conditions.
State of health (SoH) is an estimate based on observable symptoms. Capacity indicates how much charge or energy the battery can provide, internal resistance indicates how effectively it can deliver current, and self-discharge can reveal leakage, internal damage, or stress. These indicators must be interpreted together with temperature, operating history, and the battery’s chemistry.
What Battery State of Health Really Means
There is no short test that completely characterizes every condition inside a battery. State of health is not a single physical quantity that can be read directly. It is an engineering estimate whose accuracy depends on the measurements available, the test method, and the behavior being assessed.
Three practical diagnostic dimensions are especially useful:
- Capacity: the charge a battery can deliver under specified test conditions. It is closely related to runtime and available stored energy.
- Internal resistance: the opposition to current flow inside the battery. Higher resistance can reduce voltage under load, limit power delivery, and increase heat generation.
- Self-discharge: the rate at which a battery loses charge while not supplying an external load. An abnormal rate can be associated with leakage, internal damage, contamination, or other stress-related conditions.
A battery-management system may combine voltage, current, temperature, estimated capacity, resistance, usage history, and self-discharge behavior. Some systems also use models or statistical methods to reconcile these measurements. This produces a useful operational estimate, but not a universal health gauge that has the same meaning for every chemistry and application.
A battery with acceptable capacity may still have poor high-current performance if its resistance has increased. Conversely, a battery with adequate power capability may no longer provide the required runtime. The selected indicator must therefore match the application.
Why Test Conditions and Battery History Matter
Battery measurements are strongly affected by what happened immediately before the test. A battery that has just been charged may show a temporarily elevated voltage or surface charge that conceals weakness. A battery at a low state of charge may show poor voltage or runtime during a quick check even though its underlying capacity remains healthy.
Recent discharging, charging, prolonged storage, temperature changes, and the applied load can all alter measured behavior. Resistance readings are particularly dependent on test current, temperature, measurement timing, and the instrument’s method. Capacity results also depend on the discharge rate and the voltage at which the test is stopped.
For meaningful comparisons, record at least:
- battery chemistry, model, and age when known;
- state of charge and charging or discharging history;
- ambient and battery temperature;
- rest time before measurement;
- test current, load profile, and cutoff voltage; and
- the instrument, procedure, and date of the test.
Repeated measurements made under comparable conditions are more informative than unrelated snapshots. A trend showing declining capacity or rising resistance can identify deterioration earlier than a single result interpreted in isolation. Test records also help distinguish a temporarily depleted battery from one with permanent capacity loss.
Capacity, Energy, and Power: A Practical Model
A simple container analogy helps separate several battery concepts. Imagine the battery as a container that can hold a limited amount of charge. The usable part of the container represents available capacity. Permanent aging removes part of that usable space, so the container can no longer be filled to its original level.
A restricted tap or narrow flow path represents increased internal resistance. The container may still hold a substantial amount, but liquid cannot leave quickly enough to satisfy a high demand. In a battery, this appears as a greater voltage drop under load, reduced power capability, and potentially more heat.
The analogy distinguishes capacity from power, but it does not replace a measurement. Capacity concerns how much charge can be delivered. Energy, normally expressed in watt-hours, also depends on voltage over the discharge. Power, expressed in watts, describes the rate at which energy is delivered. Ampere-hours measure electrical charge and cannot automatically be treated as watt-hours without considering voltage.
For example, a battery rated at 5 ampere-hours may deliver approximately 5 amperes for approximately one hour only under the manufacturer’s specified test conditions. A different discharge current, temperature, cutoff voltage, or battery age can produce a different result. The container and tap model is therefore explanatory rather than a test method.
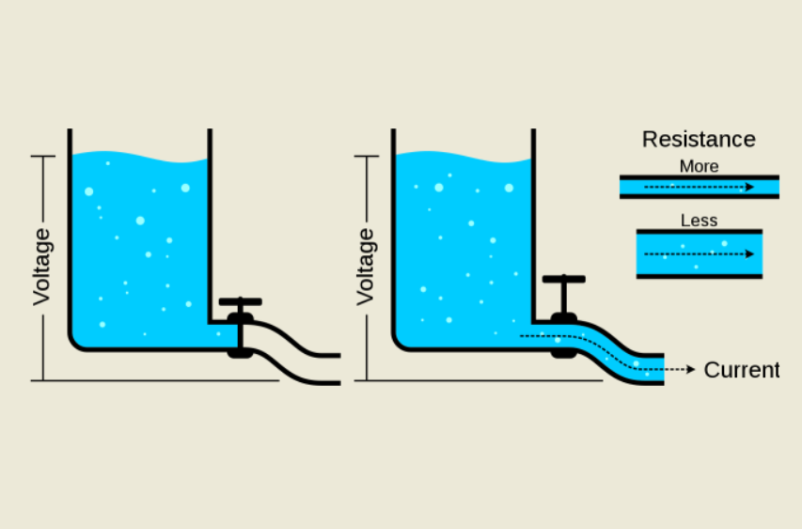
Source: Battery University

Capacity Testing and Battery Aging
Capacity testing measures the charge a battery can deliver under a defined discharge procedure. In a controlled test, the battery is charged according to a specified method, allowed to reach the required condition, and discharged at a defined current until a specified cutoff voltage. The delivered current integrated over time gives capacity in ampere-hours.
Energy testing follows a related but different approach. It accounts for voltage throughout the discharge and reports watt-hours. Two batteries with similar ampere-hour capacity can provide different energy if their operating voltages differ. For systems where runtime, heat, or usable energy is the main concern, watt-hour results may be more relevant than ampere-hours alone.
Capacity depends on several variables:
- discharge current and load profile;
- battery and ambient temperature;
- charge procedure and rest period;
- cutoff voltage; and
- the test protocol and measurement accuracy.
A simple rated-capacity value should therefore be treated as a reference, not a guaranteed runtime. A device drawing a nearly constant current may allow a straightforward approximation, but real loads can be intermittent, temperature-dependent, or affected by the battery voltage.
Capacity decline is often a practical aging indicator because it directly reduces runtime. A capacity threshold such as 80 percent is sometimes used in maintenance programs, warranties, or replacement policies, but it is not a universal law. The appropriate limit depends on the application. A consumer device may tolerate reduced runtime, while a backup system, medical application, starter battery, or safety-critical installation may require a larger reserve.
Capacity is also not always the leading health indicator. Starter and other high-power batteries may fail because they can no longer supply the required current, even if a simple capacity test appears acceptable. High-power and safety-critical systems may place greater emphasis on resistance, pulse response, temperature behavior, redundancy, and fault monitoring.
How Battery Chemistries Age Differently
Battery aging does not follow one pattern across all chemistries. The following descriptions are broad engineering tendencies, not substitutes for the manufacturer’s test procedure.
Lead-acid batteries can show capacity changes early in their service life, followed by more obvious decline as corrosion, sulfation, water loss, active-material degradation, or other mechanisms progress. Initial results vary with design, formation, storage, charge history, and test conditions, so a fixed starting percentage should not be assumed. A capacity trend is more useful than a universal initial value.
Lithium-ion batteries begin aging from manufacture through a combination of calendar aging and cycle aging. Calendar aging occurs with time and is influenced by temperature and storage state. Cycle aging is associated with charge and discharge use, current, depth of cycling, and operating conditions. Early degradation may be too small to notice in everyday runtime, even though measurable changes are already occurring.
Nickel-based batteries may show altered performance after manufacture or extended storage and can sometimes benefit from controlled conditioning or cycling. The appropriate procedure depends on the specific nickel chemistry and battery design. The older term “priming” can be ambiguous, so a test or service document should identify the actual cycling procedure and its purpose.
Chemistry, cell design, temperature, storage conditions, charging practice, load, and measurement method all affect the result. A test limit developed for one chemistry should not be transferred automatically to another.
From New-Battery Specifications to Service Decisions
Published battery specifications generally describe a new battery tested under defined laboratory conditions. Those conditions may include a specified temperature, discharge current, charge method, rest period, and cutoff voltage. A device runtime specification likewise depends on assumptions about load and operating environment.
The specification is a reference point, not a permanent promise. Aging can begin before a user notices a significant reduction in runtime. Early degradation may be masked by light loads, favorable temperatures, or excess original capacity. As the available margin narrows, the same battery may become much more sensitive to cold conditions, high current, or unexpected demand.
Replacement decisions should connect test results to operational consequences. A battery with reduced capacity may still be suitable for a noncritical application, but the same result may be unacceptable where a reserve is required. Relevant factors include:
- acceptable risk and failure consequences;
- required runtime or peak current;
- redundancy and backup availability;
- inspection and replacement labor;
- downtime and maintenance cost; and
- the reliability of the available test data.
Deferred replacement can increase service calls, unplanned failures, and downtime. Replacing too early, however, wastes usable service life. Trend-based maintenance helps balance these outcomes by showing whether performance is stable, gradually declining, or changing unusually quickly.
Why Battery Testing Remains Difficult
Battery testing is especially difficult when a decision must be made quickly while the battery remains in service. Retail technicians, healthcare operators, field-service personnel, military units, and industrial maintenance teams may need a result without removing the battery, fully charging or discharging it, or waiting through a lengthy controlled test.
State-of-charge estimation illustrates the problem. Voltage can provide useful information under suitable rest and temperature conditions, but charging, discharging, dynamic loads, internal resistance, chemistry, and temperature can move voltage away from a simple state-of-charge relationship. Coulomb counting, which integrates current entering and leaving the battery, also depends on an accurate starting state, current-sensor performance, charge efficiency, self-discharge, and the battery’s changing capacity. Sensor error and an uncertain initial condition can accumulate over time.
Modern battery-management systems can combine voltage, current, temperature, models, and historical data to improve estimates. That does not make any one input universally decisive. Open-circuit voltage alone cannot establish state of health, and a single resistance measurement cannot fully describe capacity, self-discharge, temperature response, or future reliability. Resistance results also vary with frequency, pulse duration, temperature, state of charge, and instrument method.
The most difficult classification is often the healthy-but-aging battery. A clearly failed battery is relatively easy to identify. A battery that still functions but has lost part of its reserve may pass a basic test while approaching an application-specific replacement limit. This is why rapid testers should be interpreted in context rather than treated as infallible verdicts.
The problem can be understood through the blind-men-and-elephant comparison attributed in the source material to Professor Mark Orazem. Each person touching one part of an elephant forms a partial description; disagreement results when that partial observation is treated as the whole animal. Battery measurements have a similar limitation. Capacity, resistance, self-discharge, temperature response, voltage behavior, and operating history each reveal different aspects of condition.
A more useful diagnostic process combines these partial indicators with repeated trend data. It should distinguish state of charge from state of health, account for chemistry and test conditions, and relate the result to the required runtime and power capability. The long-term goal is not only a better battery, but better monitoring throughout its service life so that degradation can be identified before failure and replacement can be planned on evidence rather than guesswork.
References
- Battery University | BU-901: Fundamentals in Battery Testing. (n.d.). http://www.batteryuniversity.com/article/bu-901-fundamentals-in-battery-testing
- Comparing State Of Charge Algorithms: Coulomb Counting Vs Model-Based. (n.d.). https://eureka.patsnap.com/report-comparing-state-of-charge-algorithms-coulomb-counting-vs-model-based
- A Review on State-of-Charge Estimation Methods, Energy .... (n.d.). https://www.mdpi.com/2032-6653/15/9/381
- How Battery Management Systems Estimate State-of-Charge and State-of-Health in Lithium-Ion Batteries. (n.d.). https://www.wonderfulpcb.com/blog/battery-management-system-soc-soh-estimation-lithium-ion
- Battery University | BU-903: How to Measure State-of-charge. (n.d.). http://www.batteryuniversity.com/article/bu-903-how-to-measure-state-of-charge
- Overview of batteries State of Charge estimation methods. (n.d.). https://www.sciencedirect.com/science/article/pii/S2352146519301905/pdf
- Battery State of Charge (SOC): What It Really Is and Why It Can Be Misleading. (n.d.). https://battlebornbatteries.com/blogs/articles/battery-state-of-charge-soc
- Optimizing State-of-Charge (SOC) Accuracy and Battery .... (n.d.). https://www.monolithicpower.com/en/learning/resources/optimizing-state-of-charge-accuracy-and-battery-management-system-design
- On state-of-charge determination for lithium- ion batteries. (n.d.). https://inldigitallibrary.inl.gov/sites/sti/sti/Sort_1351.pdf
- Battery management system: SoC and SoH Estimation Solutions. (n.d.). https://www.integrasources.com/blog/battery-management-system-bms-state-charge-and-state-health