Battery capacity is one of the most useful indicators of battery condition, but it is difficult to estimate accurately while a battery remains in normal service. Voltage, current, temperature, and internal resistance can provide clues, yet none of them is a direct measurement of how much usable charge the battery can deliver.
The conventional reference method is to fully charge the battery, discharge it under controlled conditions until a specified endpoint is reached, and then recharge it. This approach is practical for many portable batteries, but a complete test can be inconvenient or impractical for large lead-acid batteries that must remain available for service.
Starter-battery specifications also use more than one capacity-related measurement. Reserve Capacity (RC) expresses how long a fully charged battery can deliver a specified constant current before reaching a defined voltage. It is a time rating, not an ampere-hour rating. DIN and IEC capacity conventions for many starter batteries use an approximately five-hour, or 0.2C, discharge rate. Thus, a nominal 60Ah battery tested at 0.2C would be discharged at approximately 12A. RC and Ah should not be treated as directly interchangeable; shortcut conversions can provide only rough estimates because the result depends on chemistry, construction, temperature, discharge rate, and test conditions.
Controlled Discharge Capacity Testing
A controlled discharge is the most direct way to measure delivered capacity. The battery is charged according to a defined procedure, allowed to rest when required, and connected to a regulated load. The tester records current, voltage, and elapsed time until the specified cutoff voltage is reached. Capacity is then calculated from the delivered current over the measured discharge period, with the test conditions stated alongside the result.
For a constant-current test, the basic relationship is:
Capacity (Ah) = discharge current (A) × discharge time (h)
The result is meaningful only when the discharge current, cutoff voltage, temperature, charge procedure, rest period, and battery condition are known. A battery discharged at a high rate may deliver fewer ampere-hours than the same battery discharged more slowly. This rate dependence is particularly important for lead-acid batteries, although every chemistry has operating limits and test dependencies.
A typical capacity test follows this sequence:
- Fully charge the battery using a suitable charger and the procedure specified for its chemistry.
- Allow the battery to rest if the test method requires stabilization after charging.
- Apply a regulated constant-current or otherwise specified load.
- Continue the discharge until the defined cutoff voltage is reached.
- Calculate delivered capacity and record temperature and test conditions.
- Recharge the battery using the appropriate charging method.
Cycling a small portable battery can be relatively quick and can often be performed with laboratory battery equipment. Fully testing a large lead-acid battery is more disruptive. The test may take many hours, removes the battery from service, requires a substantial load bank, and places another deep discharge on a battery that may already be aged. For standby systems, vehicle batteries, and large battery banks, this practical burden is one reason rapid diagnostic methods are attractive.
Starter batteries have several related but distinct ratings. Reserve Capacity is generally reported in minutes. Under the applicable test procedure, a fully charged battery is discharged at a specified constant current until a specified terminal voltage is reached. The number of minutes is the RC value. It describes a defined runtime under a defined load; it is not a universal statement of total stored energy.
DIN and IEC capacity conventions commonly describe an approximately five-hour test, equivalent to a 0.2C rate. For example, if the nominal capacity is 60Ah:
- C = 60Ah
- 0.2C = 12A
- A five-hour discharge at 12A would correspond to 60Ah if the battery reaches the specified endpoint after five hours
This example is a test-rate calculation, not a guarantee that the battery will deliver 60Ah in every application. Temperature, age, discharge rate, charge acceptance, cutoff voltage, and the battery’s previous charging history all affect the measured result.
RC minutes cannot be reliably converted to ampere-hours with a single formula. Shortcuts such as estimating Ah from RC divided by two plus 16, or RC divided by 1.9, may be used as rough field approximations in particular contexts, but they are not substitutes for a standardized capacity test. The relationship changes with battery design and test conditions.
Even a carefully controlled discharge test has measurement variation. Battery electrochemistry, temperature, charging history, rest period, equipment accuracy, connection quality, and the precise test procedure can all change the result. Results from lithium-based and nickel-based batteries may be comparatively repeatable under suitable test conditions, but this should not be generalized to every cell design or application. Lead-acid results can be especially sensitive to state of charge, temperature, acid stratification, sulfation, and recent use.
A cited Cadex laboratory example illustrates the issue. Ninety-one starter batteries were fully charged, rested for 24 hours, and discharged with a regulated 25A load to 10.50V, or 1.75V per cell, under an SAE J537-based procedure. The test was repeated within days under nominally identical conditions. The reported Test 1 and Test 2 capacities differed by approximately plus or minus 15 percent on average in that dataset. This is not a universal uncertainty value for all batteries; it demonstrates that even a conventional reference method can produce materially different results when repeated.
That limitation matters when evaluating rapid or non-invasive methods. A new method needs a trustworthy reference dataset for calibration and comparison. If the reference measurement itself varies substantially, apparent disagreement may reflect the test method, the battery’s changing condition, or both. Controlled discharge remains the conventional benchmark, but its result should be interpreted with its test conditions and uncertainty rather than treated as an exact permanent property of the battery.
Non-Invasive Impedance-Based Capacity Estimation
Electrochemical impedance spectroscopy, or EIS, is a rapid approach that applies a small alternating-current signal to a battery over a range of frequencies and measures the voltage and current response. Because the signal is small and the battery does not normally undergo a complete discharge, the measurement can take seconds or minutes rather than requiring a full capacity cycle.
The response can be represented on a Nyquist plot. The horizontal axis normally represents the real component of impedance, while the vertical axis represents the imaginary component. Depending on the instrument and plotting convention, the imaginary axis may be shown as positive or negative. The sign convention must therefore be checked before comparing plots from different instruments. Features such as intercepts, arcs, and low-frequency tails can provide information about ohmic losses, electrochemical reaction behavior, charge transfer, and transport effects.
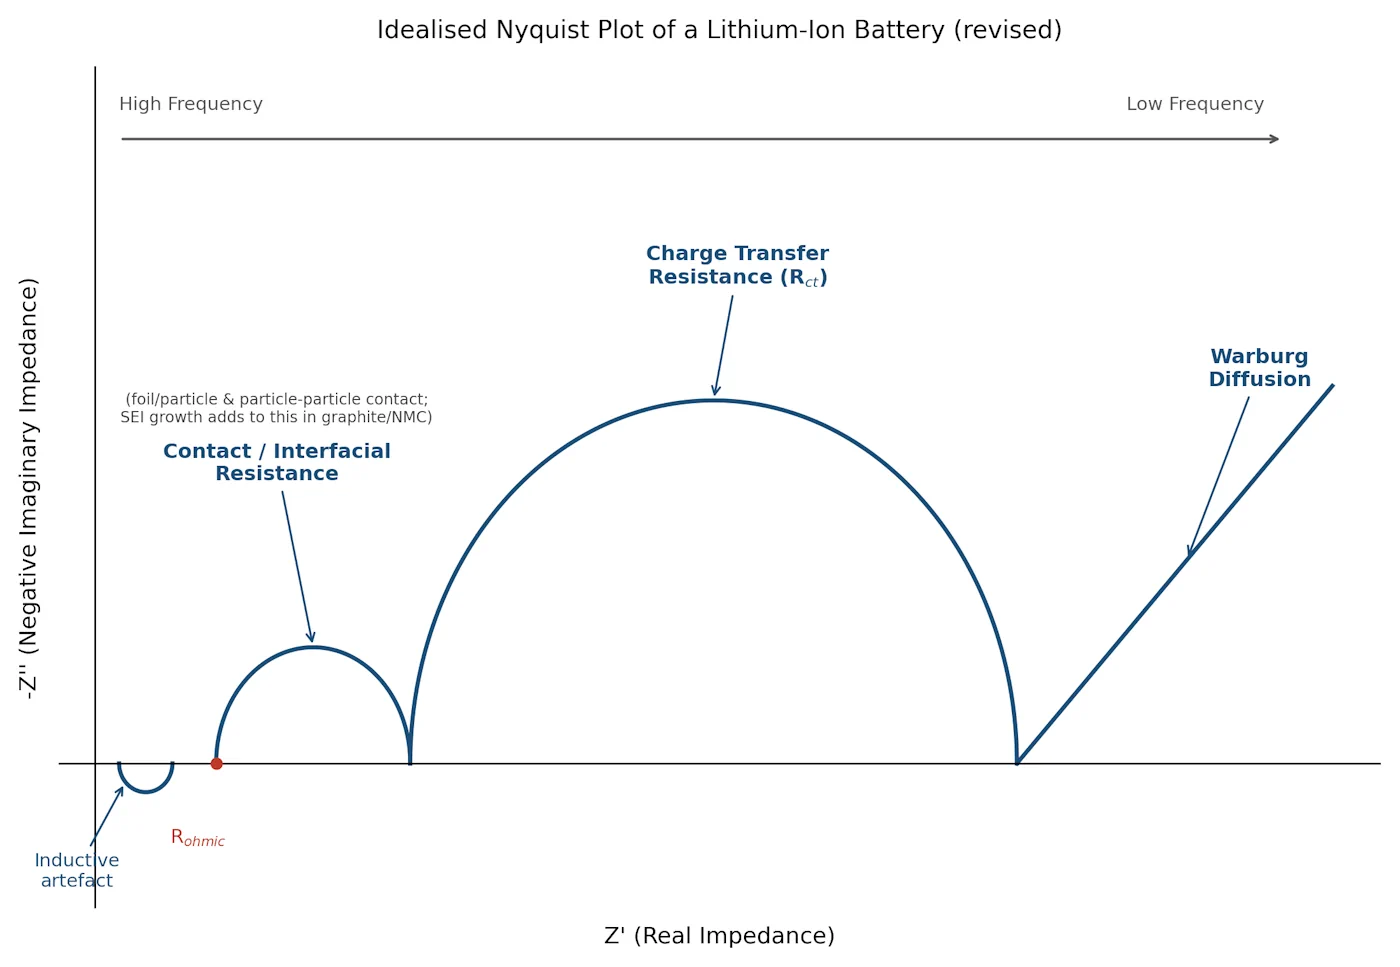
Source: Battery University

An EIS instrument does not simply read a single resistance and convert it directly into capacity. It generally combines measured frequency response with an equivalent-circuit model, signal processing, calibration data, or reference matrices. The system may compare the measured signature with batteries of known condition and estimate one or more parameters.
Those outputs must be kept separate:
- Estimated capacity describes the predicted ability to deliver charge under defined conditions.
- Estimated CCA or cranking capability describes high-current starting performance.
- State of charge (SoC) describes the present charge level, not long-term health or total capacity.
A result from one category cannot automatically be substituted for another. A battery can have a high state of charge but reduced capacity, or acceptable estimated CCA but insufficient reserve capacity.
The referenced Spectro approach is best treated as a historical or proprietary example of multi-model impedance analysis. It describes scanning a battery across frequencies and comparing the resulting signature with matrices representing different conditions. That does not mean all EIS instruments use the same signal amplitude, frequency range, models, calibration data, or accuracy. Product-specific capability claims must be checked against the instrument documentation and independent testing.
EIS estimates are affected by battery chemistry, construction, temperature, state of charge, aging mechanism, recent charging, external connections, and measurement position. A model calibrated for one family of flooded lead-acid starter batteries may not perform equally on AGM, gel, lithium, nickel-based, deep-cycle, or unusual batteries. New batteries, stored batteries, batteries with little diagnostic history, and batteries outside the instrument’s reference matrix can also produce ambiguous results.
Rapid testing is valuable when a battery must be assessed in service, particularly in large installations where a complete discharge is disruptive. However, a rapid measurement does not automatically replace a standardized capacity test. The strongest diagnostic programs use controlled capacity results to establish or verify reference data, then use rapid measurements for screening, trending, and identifying batteries that require further investigation.
Battery Capacity, CCA, and Resistance: What the Results Mean
Capacity and cold-cranking amps are different characteristics. Capacity describes how much charge a battery can deliver under a defined discharge test. CCA describes the battery’s ability to deliver a specified high current under a specified low-temperature starting test. Neither value reliably predicts the other across all starter batteries.
A starter battery may still crank an engine successfully while its usable capacity has fallen substantially. Starting may consume only a small portion of the battery’s available capacity, so a short high-current test can remain acceptable even when the battery has poor reserve runtime. Conversely, a battery can show a capacity-related problem without immediately failing a brief cranking test.
Internal resistance is useful for assessing high-current performance and detecting some abnormal conditions, but one resistance value cannot determine capacity or establish a universal replacement point. Claims that a starter battery suddenly fails near 30 percent capacity, or that replacement is appropriate near 40 percent capacity, should be treated as application- and chemistry-dependent guidance rather than universal limits. Battery design, temperature, load, service requirements, and the test method all matter.
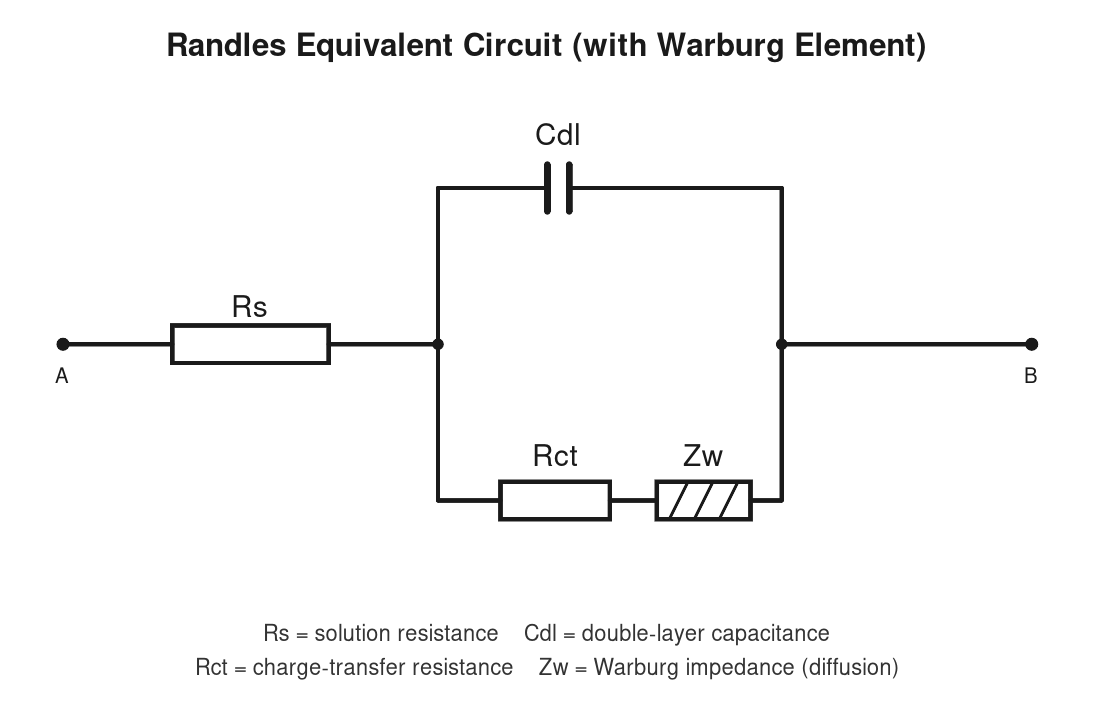
A Randles-style equivalent circuit is a useful explanatory model:
- A series or ohmic resistance represents electronic, ionic, contact, and other immediate voltage losses.
- A charge-transfer resistance represents the difficulty of electrochemical reaction at the electrode interface.
- A capacitance represents interfacial charge storage or polarization behavior.
- Additional elements may be needed to represent diffusion, porous electrodes, frequency-dependent effects, or battery-specific behavior.
Source: Battery University

The model is illustrative, not a complete physical representation of every battery. A measured resistance may include external cable and terminal resistance, internal connections, electrolyte effects, electrode reactions, and instrument-specific response. Separating these contributions through frequency analysis can provide more diagnostic information than reporting a single milliohm number.
Possible causes of increased resistance or abnormal impedance include:
- low electrolyte level in a serviceable flooded battery;
- electrolyte stratification after prolonged partial charging or limited mixing;
- sulfation or other active-material changes;
- damaged welds, current collectors, or internal intercell connections;
- plate cracking, corrosion, or loss of active material; and
- loose, corroded, contaminated, or otherwise poor external connections.
Inspection must match the battery design. Do not open sealed AGM, gel, or lithium batteries, and do not handle electrolyte without appropriate training and protective equipment. For serviceable flooded batteries, electrolyte inspection should follow the manufacturer’s instructions. Acid, hydrogen gas, short circuits, and damaged cases present real hazards; eye and skin protection, ventilation, insulated tools, and correct isolation procedures are essential.
Some rapid systems test at partial charge and can identify high resistance or an abnormal impedance signature. Such results still require interpretation. A low state of charge, recent charging, cold temperature, surface charge, poor terminals, or a chemistry mismatch can alter the reading. A tester’s diagnostic matrix must represent the battery’s construction and intended use.
Manufacturer-labeled CCA and capacity values may also differ from independently measured results because ratings use defined standards and conditions that may not match the field test. The difference is not automatically evidence that either number is incorrect; it may reflect temperature, cutoff voltage, discharge rate, test equipment, battery age, or rating convention.
Deep-cycle batteries deserve additional caution. Some may require appropriate formation, conditioning, or cycling before a capacity test reflects their expected performance, but this is not universal. The correct procedure depends on the manufacturer, chemistry, design, and application. Flooded, AGM, gel, lithium, nickel-based, and other batteries should therefore be tested and interpreted according to chemistry-specific instructions.
The practical rule is to match the measurement to the question. Use a controlled discharge when an accurate, defined capacity result is required. Use impedance or other rapid methods for screening, service decisions, and trend monitoring when their calibration and limitations are understood. Use CCA testing to assess starting capability, and do not treat resistance, CCA, state of charge, or a rapid diagnostic score as a direct replacement for measured capacity.
References
- Battery University | BU-904: How to Measure Capacity. (n.d.). http://www.batteryuniversity.com/article/bu-904-how-to-measure-capacity
- Battery University | Battery Test Methods. (n.d.). http://www.batteryuniversity.com/article/battery-test-methods
- BU-904: How to Measure Capacity - Battery University. (n.d.). https://batteryuniversity.com/article/bu-904-how-to-measure-capacity
- Spectroscopy checks Battery Capacity in 15 Seconds | Cadex Electronics. (n.d.). https://shop.cadex.com/batteries/spectroscopy-checks-battery-capacity-in-15-seconds
- Glossary of Terms - Green Cubes Technology. (n.d.). https://greencubes.com/resources/glossary-of-terms
- Lithium vs Lead Acid Batteries: The Complete Guide. (n.d.). https://www.power-sonic.com/lithium-vs-lead-acid-batteries
- [PDF] A comparison of lead-acid and lithium-based battery behavior and .... (n.d.). https://spikelab.mycpanel.princeton.edu/papers/101.pdf
- [PDF] Technical Comparison of Lead-Acid and Lithium-ion Batteries. (n.d.). https://www.baebatteriesusa.com/wp-content/uploads/2019/03/Technical-Comparison-of-Lead-Acid-and-Lithium-ion-Batteries-Schiemann-2016.pdf
- Can Lead-Acid Batteries Compete with New Chemistries? | Midtronics. (n.d.). https://www.midtronics.com/blog/can-lead-acid-batteries-compete-with-new-chemistries
- Battery Test Guide | PDF. (n.d.). https://www.scribd.com/document/249129136/Battery-Test-Guide