Lithium-ion batteries are often treated as one category, but their discharge behavior depends strongly on cell design. A cylindrical 18650 cell optimized for long runtime can behave very differently from an 18650 cell built for high-current tools, even if both use lithium-based chemistry and similar package dimensions.
Historically, lithium-ion gained attention because it offered higher energy density than older nickel-based and lead-acid batteries. It also came with stricter operating requirements. Compared with nickel and lead chemistries, lithium-ion cells require more careful voltage, current, and temperature control, and early designs were often perceived as fragile if abused electrically or thermally. Modern protection circuits, battery management systems, and improved cell designs have made Li-ion widely practical, but the basic discharge limits still matter.
A useful distinction is between energy cells and power cells. Energy cells prioritize capacity and runtime at relatively light loads. Power cells sacrifice some capacity to deliver higher current with less voltage sag and less heat rise. Lithium iron phosphate, commonly abbreviated LiFePO4 or LFP, adds another option: lower energy density but strong durability, safety reputation, cycle life, and load capability.
Li-ion Energy Cells: High Capacity for Longer Runtime
Li-ion energy cells are designed to store as much energy as possible in a given size and mass. They are suited to equipment where the average load is modest and runtime is the main requirement: portable electronics, lights, low-power instruments, and battery packs where many cells share the load.
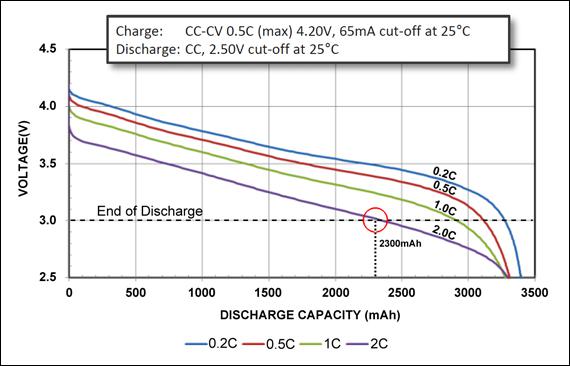
The Panasonic NCR18650B is a representative 18650 energy cell discussed in the reference data. It is listed at about 3,200 mAh and about 11.5 Wh. That high capacity is achieved by cell architecture and active material choices that favor energy storage rather than maximum current delivery.
The tradeoff becomes clear as discharge current rises. At light discharge rates, an energy cell can deliver close to its nominal capacity. At higher C-rates, voltage sag increases and the cell reaches its cutoff voltage sooner. The supplied comparison notes that at about 2C, the NCR18650B delivers roughly 2.3 Ah, well below its nominal 3.2 Ah rating. This does not mean the cell is defective; it means it is being operated outside the load range where its energy-optimized design performs best.
A C-rate expresses discharge current relative to capacity. For a 3,200 mAh cell:
- 0.5C is about 1.6 A
- 1C is about 3.2 A
- 2C is about 6.4 A
The reference comparison table places Li-ion energy cells in the 1C light-load category. In practical pack design, this does not mean every energy cell can always be used comfortably at exactly 1C under every condition. It means the cell class is generally intended for moderate discharge, not continuous high-current work.
Temperature has a major effect on delivered capacity. For the NCR18650B energy-cell example, the supplied cold-temperature retention values are approximately:
| Cell temperature | Approximate delivered capacity retention |
|---|---|
| 25°C | 100% |
| 0°C | 83% |
| -10°C | 66% |
| -20°C | 53% |
Cold operation reduces ion mobility and increases internal resistance. The result is lower voltage under load, earlier cutoff, and shorter runtime. The effect is especially important when an energy cell is asked to supply high current in cold conditions, because both high C-rate and low temperature push the voltage downward.
Source: Battery University

For engineering use, the key point is load matching. Energy cells are excellent when the system needs high watt-hours and the discharge current per cell is kept modest. They are poor choices for applications that repeatedly demand large current pulses or sustained high current unless the pack uses enough parallel cells to reduce stress on each individual cell.
Li-ion Power Cells: Lower Capacity but Strong High-Load Performance
Li-ion power cells are designed for applications where current delivery is more important than maximum capacity. Typical uses include power tools, robotics, industrial devices, e-bikes, medical equipment with motor loads, and other systems that impose heavy or pulsed current demand.
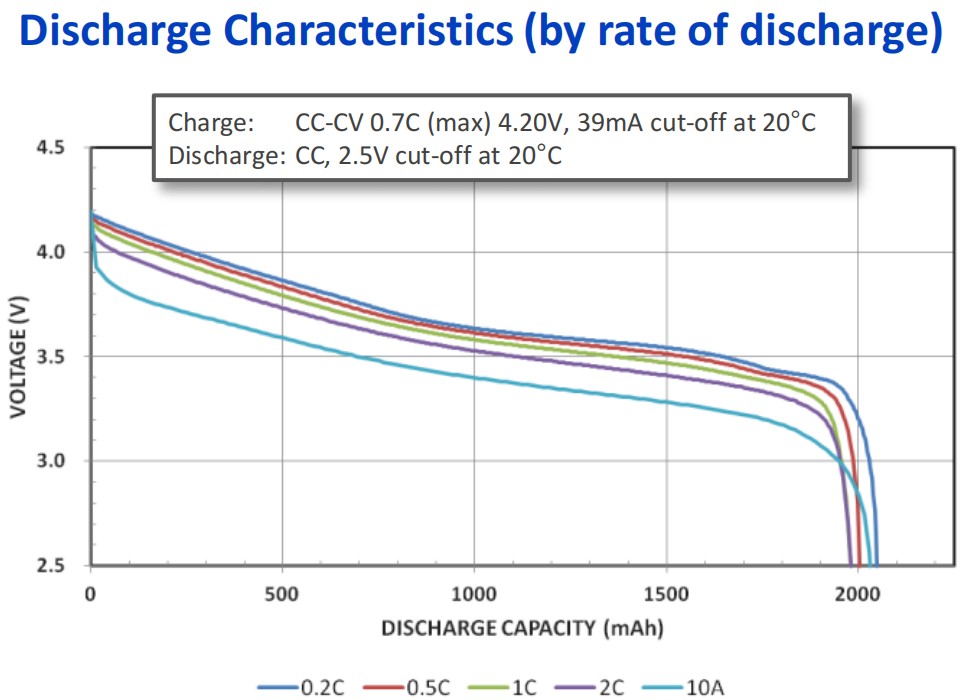
The Panasonic UR18650RX is a representative power-cell example from the supplied material. Its capacity is lower than the NCR18650B energy cell, at about 1,950 to 2,000 mAh, with an energy figure of about 7.2 Wh. That looks like a disadvantage if only nameplate capacity is considered. Under heavy load, however, the power cell can deliver much more of its rated capacity because its voltage remains higher and its internal losses are lower.
The reference data states that a 10 A discharge, roughly 5C for a 2,000 mAh cell, shows minimal capacity loss to a 3.0 V per cell cutoff. The same data describes the UR18650RX being discharged at 0.2C, 0.5C, 1C, 2C, and 10 A, with all cases reaching the 3.0 V/cell cutoff at about 2,000 mAh. This is the defining behavior of a power cell: lower nominal capacity, but much stronger capacity delivery when current is high.
Cold-temperature retention is also better in the supplied power-cell example:
| Cell temperature | Approximate delivered capacity retention |
|---|---|
| 25°C | 100% |
| 0°C | 92% |
| -10°C | 85% |
| -20°C | 80% |
This does not mean cold has no effect on power cells. Internal resistance still rises at low temperature, and voltage sag still increases. But compared with the energy-cell example, the power cell retains a larger fraction of usable capacity under cold conditions.
Power-cell performance comes from design choices such as:
- lower internal resistance;
- active material structures that improve current flow;
- optimized electrode surface area;
- construction that better tolerates heat generation and high current density.
Lower resistance reduces the voltage drop inside the cell and reduces I²R heating for a given current. That allows higher current to be supplied before the cell reaches thermal or voltage limits.
The supplied reference states that some Li-ion power cells permit about 10C continuous discharge. For a 2,000 mAh 18650 cell, 10C corresponds to about 20 A, assuming the particular cell and pack design allow it. The same source notes that at maximum permissible discharge current, a Li-ion power cell may heat to about 50°C, with temperature limited to about 60°C.
Source: Battery University

Those temperature values should not be interpreted as a general permission to run all Li-ion cells hot. They describe power-cell behavior under maximum-load conditions in the reference context. In real products, allowable current depends on the exact cell datasheet, pack layout, cooling, interconnect resistance, enclosure temperature, aging state, and battery management limits.
LiFePO4 Power Cells: Robust High-Current Lithium Chemistry
Lithium iron phosphate cells are part of the lithium-ion family but have a different cathode chemistry from many high-energy Li-ion cells. LiFePO4 generally trades lower nominal voltage and lower energy density for strong robustness, thermal stability, long cycle life, and high-current capability.
The supplied comparison table lists representative values for a LiFePO4 power cell:
| Chemistry type | Nominal voltage | Capacity | Energy | Cycle life | Loading capability in table context |
|---|---|---|---|---|---|
| Li-ion Energy | 3.6 V/cell | 3,200 mAh | 11.5 Wh | ~1,000 | 1C |
| Li-ion Power | 3.6 V/cell | 2,000 mAh | 7.2 Wh | ~1,000 | 5C |
| LiFePO4 | 3.3 V/cell | 1,200 mAh | 3.9 Wh | ~2,000 | 25C |
These values are useful as a comparison of battery architectures rather than universal ratings for every cell on the market. The table illustrates the engineering tradeoff: the LiFePO4 example stores less energy per cell than the Li-ion energy and power examples, but it offers much greater loading capability and about double the listed cycle life.
LiFePO4’s nominal voltage of about 3.3 V per cell is lower than the 3.6 V per cell shown for the other Li-ion examples. For a given series-cell count, the pack voltage is therefore lower. Designers may need more cells in series or different power electronics to reach the same system voltage.
Where LiFePO4 is attractive:
- high-current equipment where load handling is more important than compact energy storage;
- battery packs requiring long cycle life;
- systems where thermal stability and safety reputation are major selection factors;
- applications where mass and volume are less constrained than durability.
Compared with Li-ion energy cells, LiFePO4 generally gives up capacity and energy density. Compared with Li-ion power cells, it can offer even stronger high-load behavior in the table context, but again with lower energy content. The best choice depends on the product requirement: maximum runtime, maximum current, long service life, or a balance among all three.
Discharge Signature: Voltage, Load Pulses, and Recovery Behavior
A battery’s discharge signature is the observable way its voltage and usable capacity respond during operation. It includes the steady discharge curve, voltage sag during high current, recovery after a load is removed, and behavior under repeated pulses.
For lithium-ion cells, several variables shape the discharge signature:
- C-rate: Higher current causes greater voltage drop and more heat.
- Internal resistance: Lower resistance reduces voltage sag and heating.
- Temperature: Cold increases resistance and reduces delivered capacity.
- Cutoff voltage: A higher cutoff stops discharge earlier; a lower cutoff extracts more capacity but may increase stress if outside safe limits.
- Cell design: Energy, power, and LiFePO4 cells are optimized differently.
Power-oriented lithium-ion designs can provide continuous high power better than energy-oriented designs because they maintain voltage more effectively under load. In contrast, cells not built for high current may show deep voltage sag during pulses and may reach cutoff early even though chemical energy remains in the cell. After the load is reduced or removed, the voltage may recover. This recovery can make the battery appear to regain charge, but it is mainly an electrochemical relaxation effect rather than newly created capacity.
Different battery chemistries and cell constructions recover at different rates after heavy current draw. A cell with high polarization under load may show a pronounced voltage rebound after the current stops. A power cell with low internal resistance and better high-rate kinetics typically shows less extreme sag and more stable voltage delivery.
Pulsed loads are especially important in communication and motor-drive applications. The reference discussion includes GSM-style pulse discharges, where a device draws short bursts of current rather than a smooth continuous load. Pulses can stress the cell more than the same average current would suggest because the instantaneous current is high. During each pulse, voltage drops; between pulses, voltage partially recovers. Runtime then depends not only on average power but also on pulse amplitude, pulse duration, rest interval, temperature, and cutoff threshold.
This is why two devices with the same average wattage can produce different runtimes from the same battery. A smooth load may allow the cell to stay above cutoff longer. A pulsed load may repeatedly drag voltage below the cutoff point, causing early shutdown or reduced usable capacity.
In pack design, discharge signature matters for fuel gauging and protection. State-of-charge estimation based only on voltage can be misleading under high current or cold conditions. Battery management systems often need current, temperature, cell-voltage history, and relaxation behavior to estimate remaining energy accurately.
Practical Guidelines for Discharging Li-ion Batteries
Good discharge practice starts with using the right cell for the load. A high-capacity energy cell is not automatically better than a lower-capacity power cell. If the application draws high current, the power cell may deliver longer real runtime because it wastes less energy as heat and reaches cutoff later.
Use these guidelines when selecting and operating lithium-ion batteries:
Match cell type to discharge profile.
Use energy cells for long runtime at light or moderate load. Use power cells for high-current tools, motors, robotics, and industrial loads. Consider LiFePO4 where robustness, cycle life, thermal stability, and heavy loading are higher priorities than maximum energy density.Avoid over-discharge.
Respect the device, pack, or cell cutoff voltage. Discharging below the intended lower voltage limit can damage lithium-ion cells and may create safety and reliability problems. In multi-cell packs, cell imbalance makes this more critical because one weak cell can reach the lower limit before the pack voltage looks empty.Limit excessive heat.
Elevated temperature accelerates aging and can reduce battery life. High current increases internal heating, especially when the cell has higher resistance, poor cooling, aged electrodes, or undersized interconnects. A pack should be designed so cells remain within the manufacturer’s operating limits under worst-case load and ambient conditions.Prefer moderate, steady discharge where possible.
Sustained operation at maximum rated current gives the cell little thermal margin. Moderate loads reduce voltage sag, improve delivered capacity, and lower stress. If high power is unavoidable, choose cells designed for it and provide adequate thermal paths.Account for pulsed loads.
Pulses can cause brief but large voltage drops. A cell that appears suitable by average current may still fail in service if pulse current pulls voltage below cutoff. Motor starting, RF transmit bursts, solenoids, and power-tool impacts all require attention to peak current as well as average current.Design for cold-temperature runtime loss.
Cold cells deliver less capacity and show greater voltage sag because internal resistance rises. The supplied examples show a large difference between an energy cell retaining about 53% at -20°C and a power cell retaining about 80% at the same temperature. Systems used outdoors or in cold storage should include temperature-related derating.Do not rely only on nameplate capacity.
Capacity ratings are usually measured under specified test conditions. Real usable capacity depends on load current, temperature, cutoff voltage, cell age, and pack design. For high-load applications, discharge curves are more informative than capacity alone.
A practical selection rule is simple: choose the cell whose discharge curve matches the actual load. For low current and maximum runtime, energy cells are appropriate. For sustained current, high pulses, or cold operation, power cells are often more reliable. For applications that prioritize long cycle life and heavy loading over compact energy storage, LiFePO4 can be the better engineering choice.
References
- Battery University | BU-501a: Discharge Characteristics of Li-ion. (n.d.). https://www.batteryuniversity.com/article/bu-501a-discharge-characteristics-of-li-ion
- Battery University | BU-501a: Discharge Characteristics of Li-ion. (n.d.). http://www.batteryuniversity.com/article/bu-501a-discharge-characteristics-of-li-ion
- What Are the Discharge Characteristics of Li-ion Batteries. (n.d.). https://www.large-battery.com/blog/discharge-characteristics-of-li-ion-batteries-explained
- Discharge Characteristics of Li-ion. (n.d.). https://www.szaspower.com/industry-news/Li-ion-Discharge-Characteristics%E2%80%8B.html
- A comprehensive overview of lithium-ion batteries for electric .... (n.d.). https://www.sciencedirect.com/science/article/pii/S2352152X25044081
- What determines battery pack amp handling capacity? - Facebook. (n.d.). https://www.facebook.com/groups/electricmotorcyclebuilds/posts/2747424445394909
- BU-808: How to Prolong Lithium-based Batteries. (n.d.). http://www.batteryuniversity.com/article/bu-808-how-to-prolong-lithium-based-batteries
- Study on Discharge characteristics of the Lithium -Ion Battery. (n.d.). https://www.academia.edu/42648942/Study_on_Discharge_characteristics_of_the_Lithium_Ion_Battery
- Lithium Batteries Discharging at High and Low Temperatures. (n.d.). https://www.large-battery.com/blog/lithium-batteries-discharging-at-high-and-low-temperatures
- Experimental data of lithium-ion batteries under galvanostatic discharge tests at different rates and temperatures of operation. (n.d.). https://pmc.ncbi.nlm.nih.gov/articles/PMC7941039