State of charge (SoC) is an estimate of how much usable charge or energy remains in a battery relative to the battery’s defined full condition. It is not the same as state of health (SoH), which describes aging and loss of capacity, depth of discharge (DoD), which is the portion already removed, or remaining runtime, which also depends on load and operating conditions.
Battery SoC is normally inferred rather than measured directly. Voltage, electrolyte specific gravity, current integration, impedance response, and combinations of these methods can all provide useful information. None is universally precise. Chemistry, temperature, recent charging or discharging, load, polarization, self-discharge, battery age, capacity loss, and calibration quality can all change the result.
A percentage shown by a battery monitor or battery-management system is therefore a model output. It may represent estimated remaining usable capacity under defined conditions rather than a universal measurement of remaining energy or runtime.
State-of-Charge Measurements and Their Accuracy Limits
The four practical approaches covered here use different battery behaviors:
- Voltage estimation compares a measured terminal or open-circuit voltage with a chemistry-specific voltage-versus-SoC relationship.
- Hydrometer measurement uses electrolyte specific gravity and is mainly applicable to accessible flooded lead-acid batteries.
- Coulomb counting integrates current entering and leaving the battery over time.
- Impedance methods interpret the battery’s electrical response using instrumentation and a validated model.
Measurements can be misleading immediately after charging or discharging, while a battery is under load, or while its temperature is changing. A battery may also show a plausible voltage while having substantially reduced capacity because of aging. For this reason, practical accuracy depends on the battery’s chemistry, history, operating state, calibration, and the quality of the reference model.
A useful measurement procedure begins by identifying what the displayed percentage means. Capacity-based SoC and energy-based SoC are related but not identical: voltage, current, temperature, and discharge rate affect the energy that can actually be delivered. The same nominal percentage can therefore produce different runtime in a new battery, an aged battery, or a battery operating at low temperature.
Source: Battery University

Estimating SoC from Voltage
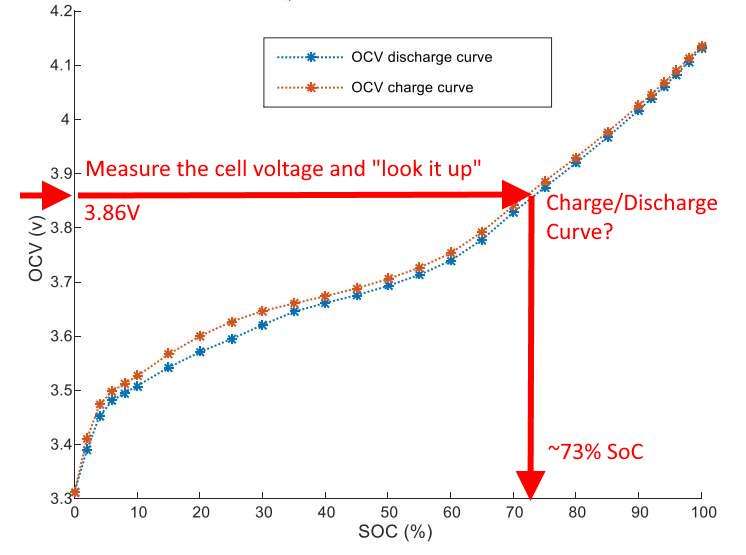
Voltage estimation is simple, inexpensive, and available in almost every battery system. It becomes most informative when the battery is at rest and the voltage can be compared with a table or model developed for that exact chemistry and battery design.
An open-circuit voltage (OCV) is measured with no significant current entering or leaving the battery. A terminal voltage measured while charging or supplying a load is different: it includes the effects of internal resistance, polarization, wiring losses, and the current itself. It should not be interpreted using an open-circuit voltage table without suitable correction.
Immediately after charging, surface charge can temporarily raise the measured voltage. After discharge, polarization and recovery effects can depress or change the voltage as the battery relaxes. Parasitic loads in a vehicle or other connected system can also prevent a true open-circuit condition. A controlled load or a sufficiently long rest period may be needed before using voltage as an SoC indicator. Battery University cites at least four hours as a general rest period and notes that lead-acid manufacturers may recommend 24 hours; the battery manufacturer’s procedure should take precedence.
Voltage estimation is generally more useful for a rested lead-acid battery than for many lithium-ion batteries. Lithium-ion cells often have a relatively flat discharge curve through part of their operating range. Lithium iron phosphate (LiFePO4) is particularly difficult to evaluate from voltage alone because a small voltage change can correspond to a large change in SoC. Voltage can still contribute to an estimate, but it may provide limited resolution in the middle of the range.
Lead-acid voltage is affected by more than SoC. Relevant factors include electrolyte temperature, plate formulation, battery construction, AGM design, surface charge, internal resistance, and connected vehicle loads. Calcium additives and other design features can change the voltage behavior, so a generic voltage table is not a substitute for the manufacturer’s specifications.
For orientation, the following reference is specifically for a 12 V starter battery with antimony, measured at approximately 26°C after a 24-hour rest. It is not a universal table for all 12 V lead-acid batteries:
| Approximate SoC | Open-circuit voltage |
|---|---|
| 100% | 12.65 V |
| 75% | 12.45 V |
| 50% | 12.24 V |
| 25% | 12.06 V |
| 0% | 11.89 V |
The table illustrates why measurement conditions must be stated. A battery with a different electrolyte formulation, construction, temperature, or resting history can produce different values. A loaded reading should not be compared directly with this table.
Nickel-based batteries also require their own interpretation. Their discharge and relaxation behavior differs from both lead-acid and lithium-ion systems, so lead-acid or lithium voltage tables should not be applied to nickel-based batteries.
Battery-management systems often improve voltage-based estimates by detecting rest periods, applying temperature compensation, learning battery behavior, and periodically recalibrating against known charge conditions. Voltage is therefore frequently one input to a model rather than the entire SoC measurement.
Using a Hydrometer for Flooded Lead-Acid Batteries
A hydrometer measures the specific gravity of the electrolyte. In a flooded lead-acid battery, charging increases the concentration of sulfuric acid in the electrolyte, raising its density. During discharge, sulfuric acid is consumed in the cell reaction and converted into lead sulfate, so the electrolyte becomes less dense.
This method is primarily suitable for an accessible, serviceable flooded lead-acid battery. It is not a normal measurement option for sealed lead-acid batteries, AGM batteries, gel batteries, or lithium batteries because their electrolyte is not safely or practically available for sampling.
Specific-gravity readings must be interpreted using the battery manufacturer’s information or an appropriate industry reference. There is no single full-charge value for every lead-acid application. Battery University reports approximate full-charge specific gravities of up to 1.330 for some deep-cycle batteries, about 1.285 for aviation batteries, approximately 1.280 for traction batteries, 1.265 for starter batteries, and about 1.225 for stationary batteries. These values reflect different designs and intended operating priorities.
The following reference table is limited to a BCI-style starter-battery reference with antimony. Readings are specified at approximately 26°C after a 24-hour rest:
| Approximate SoC | Average specific gravity | 2 V cell | 6 V battery | 8 V battery | 12 V battery |
|---|---|---|---|---|---|
| 100% | 1.265 | 2.10 V | 6.32 V | 8.43 V | 12.65 V |
| 75% | 1.225 | 2.08 V | 6.22 V | 8.30 V | 12.45 V |
| 50% | 1.190 | 2.04 V | 6.12 V | 8.16 V | 12.24 V |
| 25% | 1.155 | 2.01 V | 6.03 V | 8.04 V | 12.06 V |
| 0% | 1.120 | 1.98 V | 5.95 V | 7.72 V | 11.89 V |
These values are illustrative rather than universal specifications. Electrolyte temperature changes the reading, so the measurement should include a stated reference temperature or an appropriate correction. Fluid level also matters. Evaporation can increase concentration, while overfilling can dilute the electrolyte. Water added during service needs time to mix with the electrolyte before the reading is treated as representative.
Stratification can produce different electrolyte concentrations at different heights in the cell. Charging, discharging, or an appropriate controlled mixing procedure may be needed to reduce this effect before sampling. Readings should be compared between cells as well as against an SoC table. A significantly different cell can indicate imbalance, sulfation, electrolyte problems, or a failing cell rather than simply a different overall SoC.
Hydrometer work requires acid-safe equipment and careful handling. Wear suitable eye and skin protection, protect clothing and nearby equipment from sulfuric acid, provide adequate ventilation, and follow the battery and instrument manufacturer’s procedures. Do not use a hydrometer on a battery that is not designed to be opened or sampled.
Coulomb Counting and Battery-Gauge Models
Coulomb counting estimates SoC by integrating current over time. Current entering and leaving the battery is accumulated in ampere-seconds or ampere-hours. In simplified form, the estimate starts from a known SoC and adds charge during charging while subtracting charge during discharge.
The method is widely used in portable electronics, electric vehicles, energy-storage systems, and battery-management systems because it works during operation and does not require the battery to remain at rest. Its accuracy depends on several assumptions and measurements:
- the initial SoC must be known or reasonably estimated;
- the current sensor must measure both charge and discharge accurately;
- parasitic currents and system loads must be included;
- the usable capacity must be appropriate for the battery’s age and temperature; and
- the model must account for charging and discharging efficiency.
Charge and discharge are not perfectly reversible. Coulombic efficiency describes the ratio of charge returned to charge supplied in electrical quantity; it is different from energy efficiency, which also includes voltage. Self-discharge, sensor offset, noise, unmeasured loads, changing current, and temperature can all cause the integrated estimate to drift.
Drift is cumulative. A small current-sensor offset that appears insignificant over a short period can create a meaningful SoC error over many hours or cycles. Battery gauges therefore need periodic synchronization or calibration against a known condition, such as a validated full-charge termination point. The exact procedure depends on the battery and gauge manufacturer.
Modern fuel gauges commonly combine coulomb counting with additional information, including voltage, temperature, impedance, charge termination behavior, discharge history, and learned capacity. This allows the gauge to update its estimate as the battery ages. A battery that once delivered its rated capacity may later deliver less; without a revised usable-capacity estimate, the displayed percentage can become misleading.
The displayed percentage is consequently a model output, not a direct measurement of remaining energy or runtime. At low temperature, for example, available capacity and power capability can change even if the integrated charge quantity has not changed proportionally. Near full and near empty, the gauge may also apply reserve margins and operating limits that are not visible in the user-facing percentage.
Impedance Spectroscopy for SoC Estimation
Impedance spectroscopy measures how a battery responds electrically to an applied signal or changing operating condition, often across a range of frequencies. The measured response can be related to battery condition and, with a validated chemistry-specific model, used to estimate SoC or support other diagnostic conclusions.
The approach can provide information that a single terminal-voltage reading cannot. For example, voltage may change during load removal as polarization and recovery effects relax. A properly designed and validated impedance model may distinguish some of those effects from a change in stored charge. This is a conceptual advantage, not a guarantee that every impedance instrument will produce a stable or accurate SoC value in every situation.
Potential applications include automotive testing, battery screening, service diagnostics, transport preparation, and stationary energy systems. However, the method depends on the instrumentation, signal and frequency range, test conditions, chemistry-specific response, temperature, and quality of the model used to interpret the data.
Impedance is also influenced by state of health, cell history, temperature, current conditions, and aging. A battery with reduced capacity may have an impedance response that differs from that of a new battery at the same SoC. Modern approaches can account for state of health, but the result still depends on model validation across the relevant battery population and operating range.
A steady external load does not automatically make an impedance-based SoC estimate accurate. The instrument or algorithm may require charging to be absent, a controlled excitation, a defined rest or operating condition, or other restrictions. Those requirements are implementation-specific and should be taken from the equipment documentation.
It is also important to distinguish general impedance spectroscopy from proprietary commercial algorithms. A branded tester may combine impedance measurements with voltage, current, temperature, and a learned battery model. Its results should not be presented as a universal capability of impedance spectroscopy itself.
In practice, impedance methods are best treated as one part of a battery-diagnostic system. They can supplement voltage and coulomb counting, particularly where direct access to electrolyte is impossible, but their accuracy remains dependent on chemistry, instrumentation, calibration, operating conditions, and the battery’s state of health.
References
- Battery University | BU-903: How to Measure State-of-charge. (n.d.). http://www.batteryuniversity.com/article/bu-903-how-to-measure-state-of-charge
- Battery University | BU-808: How to Prolong Lithium-based Batteries. (n.d.). http://www.batteryuniversity.com/article/bu-808-how-to-prolong-lithium-based-batteries
- Comparing State Of Charge Metrics Across Lead-Acid And .... (n.d.). https://eureka.patsnap.com/report-comparing-state-of-charge-metrics-across-lead-acid-and-lithium-ion-batteries
- How to Measure State-of-Charge in Lithium Batteries. (n.d.). https://www.large-battery.com/blog/measure-state-of-charge-of-lithium-batteries-methods-guide
- Characterization of Li-ion battery and state of charge Estimation methods for diverse battery chemistries: a review | Discover Applied Sciences | Springer Nature Link. (n.d.). https://link.springer.com/article/10.1007/s42452-025-07906-1
- Battery State of Charge (SOC): What It Really Is and Why It Can Be Misleading. (n.d.). https://battlebornbatteries.com/blogs/articles/battery-state-of-charge-soc
- What are SOC and SOH of a battery, how to measure them?. (n.d.). https://www.biologic.net/topics/battery-states-state-of-charge-soc-state-of-health-soh
- State of Charge Estimation Method for Lithium-Ion Batteries .... (n.d.). https://www.mdpi.com/2313-0105/12/3/84
- The Methods for Estimating State of Charge in Lithium-Ion Batteries. (n.d.). https://pmc.ncbi.nlm.nih.gov/articles/PMC13028534
- Lithium-Ion State of Charge (SoC) measurement - Coulomb Counter method. (n.d.). https://www.powertechsystems.eu/tech-corner/lithium-ion-state-of-charge-soc-measurement